How intrepid Victorian surveyors mapped the length and breadth of Britain
Today’s country walkers owe much to the theodolite-lugging cartographers of the early Ordnance Survey
Britain’s ramblers, striding up hills and down dales, swear by the orange Explorer maps produced by Ordnance Survey (OS). The national mapping agency is also important for managing land use and infrastructure. For centuries, though, no one had set out to systematically and accurately map the British isles in their entirety. It was not until the 19th century that OS created the first comprehensive, detailed picture of Britain. Just as today’s paper OS maps fit together in a jigsaw that stretches over the country, when OS began its cartographic project around 1800 it progressed sheet by sheet. The task would take eight decades and involved considerable hardship for the hundreds of surveyors employed to carry it out. We have pieced together these early maps, in a method pioneered by Living with Machines, a research project, to illustrate how the first efforts of OS, rooted in military threats, adapted to keep up with a country being transformed by the Industrial Revolution.
In an enjoyable book, “Map of a Nation”, Rachel Hewitt tells the history of this first complete map. There is a clue to the original purpose of OS maps in the agency’s name: “ordnance” means artillery and munitions. OS grew out of the Board of Ordnance, a government body set up in Tudor times to help defend Britain. To see off invaders, you must know the lie of your land. OS started around the time of the Napoleonic wars, when Europe splintered into a fractious set of alliances and Britain faced constant military threats.
Reflecting worries that the French might invade, the first OS maps cover the mouth of the river Thames. This is the naval route to London and a highly vulnerable part of the country.
The sheets that follow stretch along the south coast: Dorset, Devon and on to Cornwall. These areas were similarly vulnerable to a French naval attack.
In the Bristol Channel the sheet for Lundy Island was delayed because, embarrassingly, it was surveyed by a trainee who put Lundy in the wrong place. The island had to be resurveyed and the map’s copper printing plate planed and re-engraved.
As they worked through Wales, the English-speaking surveyors struggled with Welsh place names, mangling many. Croeswdig was mapped as “Crosswoodig”, Rhos-y-cribed as “Rosey cribelt”.
OS developed a system for determining how place names should be spelled. This included checking with reputable members of the community. Landowners and the clergy were considered reliable. Small farmers and crofters were not, even if they had deep roots in an area.
The French threat had not been forgotten. A spot on the coast near Fishguard in Wales, mapped in 1819, is marked: “about 1000 Frenchmen landed here in 1797”, memorialising an attempted invasion.
OS’s path sweeps steadily northwards. Lincolnshire, though, was surveyed early and out of order. Excited at the prospect of showing off maps of their estates, landowners in the county offered to buy 500 maps if prioritised. They may have come to regret this: OS was still finding its feet and errors crept in. The results were, as the head of OS at the time put it, “slovenly”.
The prospect of invasion had receded by the middle of the century. Mapping in England paused in the 1840s. This was because the surveyors were shipped to Ireland to produce accurate maps for land taxation.
In Scotland surveying commenced in 1843 (the year The Economist was first published). The survey swept from south-west to north-east over time.
The Isle of Lewis in the Outer Hebrides was mapped out of sequence. James Matheson, who owned all of Lewis, paid OS to map it early. He made a case that he needed the maps to make agricultural improvements on his land.
The pace of the Industrial Revolution—with new railway lines, growing urban centres and sites of industry—made maps out of date even before they had been engraved onto copper plates for printing. Survey progress slowed as OS was distracted updating sheets.
West of London, for example, we can compare two versions of the same map. To keep up with the railways, mapmakers sometimes engraved new railway lines straight over the top of existing designs. Moving elements engraved on a metal plate is hard. The new lines run through the map labels.
This wasn’t the only challenge the railways posed. During “railway mania”, rapidly expanding rail companies poached surveyors from OS: almost 300 staff left in 1845.
As its work progressed, OS found new audiences. The Poor Law Commission was concerned with sanitary conditions in crowded cities. It commissioned maps for places like Manchester at a much larger cartographic scale with street-level detail. OS progress slowed as surveyors were occupied with other assignments.
In Scotland, delays caused by a dispute over the choice of cartographic scale and a lack of funds and staff were compounded by difficult Highland terrain and weather. Surveyors might be encamped on a mountain for weeks waiting for the mist to break. Tents were blown away, and surveyors complained of having to survive on porridge.
Field surveying was limited to the spring and summer. Unfortunately this overlapped with deer-stalking season. The survey clashed with Highland deer-forest proprietors who did not want surveyors on their land.
The final Scottish maps, of Orkney and Shetland, were published in 1882, eight decades after the project began with the first maps of Kent.
The process of making these maps was slow, arduous and physical. The early OS surveyors marched through remote countryside, weighed down with heavy instruments. They began by setting out an initial skeleton of locations, measured to a high degree of accuracy. The skeleton was connected in a mesh of triangles (see below). Further surveying could then fill in the details within the triangles. Laying out these triangles was done by first measuring a “baseline”: the straight-line distance between two points. OS first did this on Hounslow Heath, now in west London. Once surveyors knew the distance between the two ends of the baseline, they picked a faraway landmark (or “trig-point”) and measured the angle to the landmark from each end of the baseline. Using trigonometry they calculated the distances between each point. They then continued, creating more triangles off the first one, until they had covered an entire area.
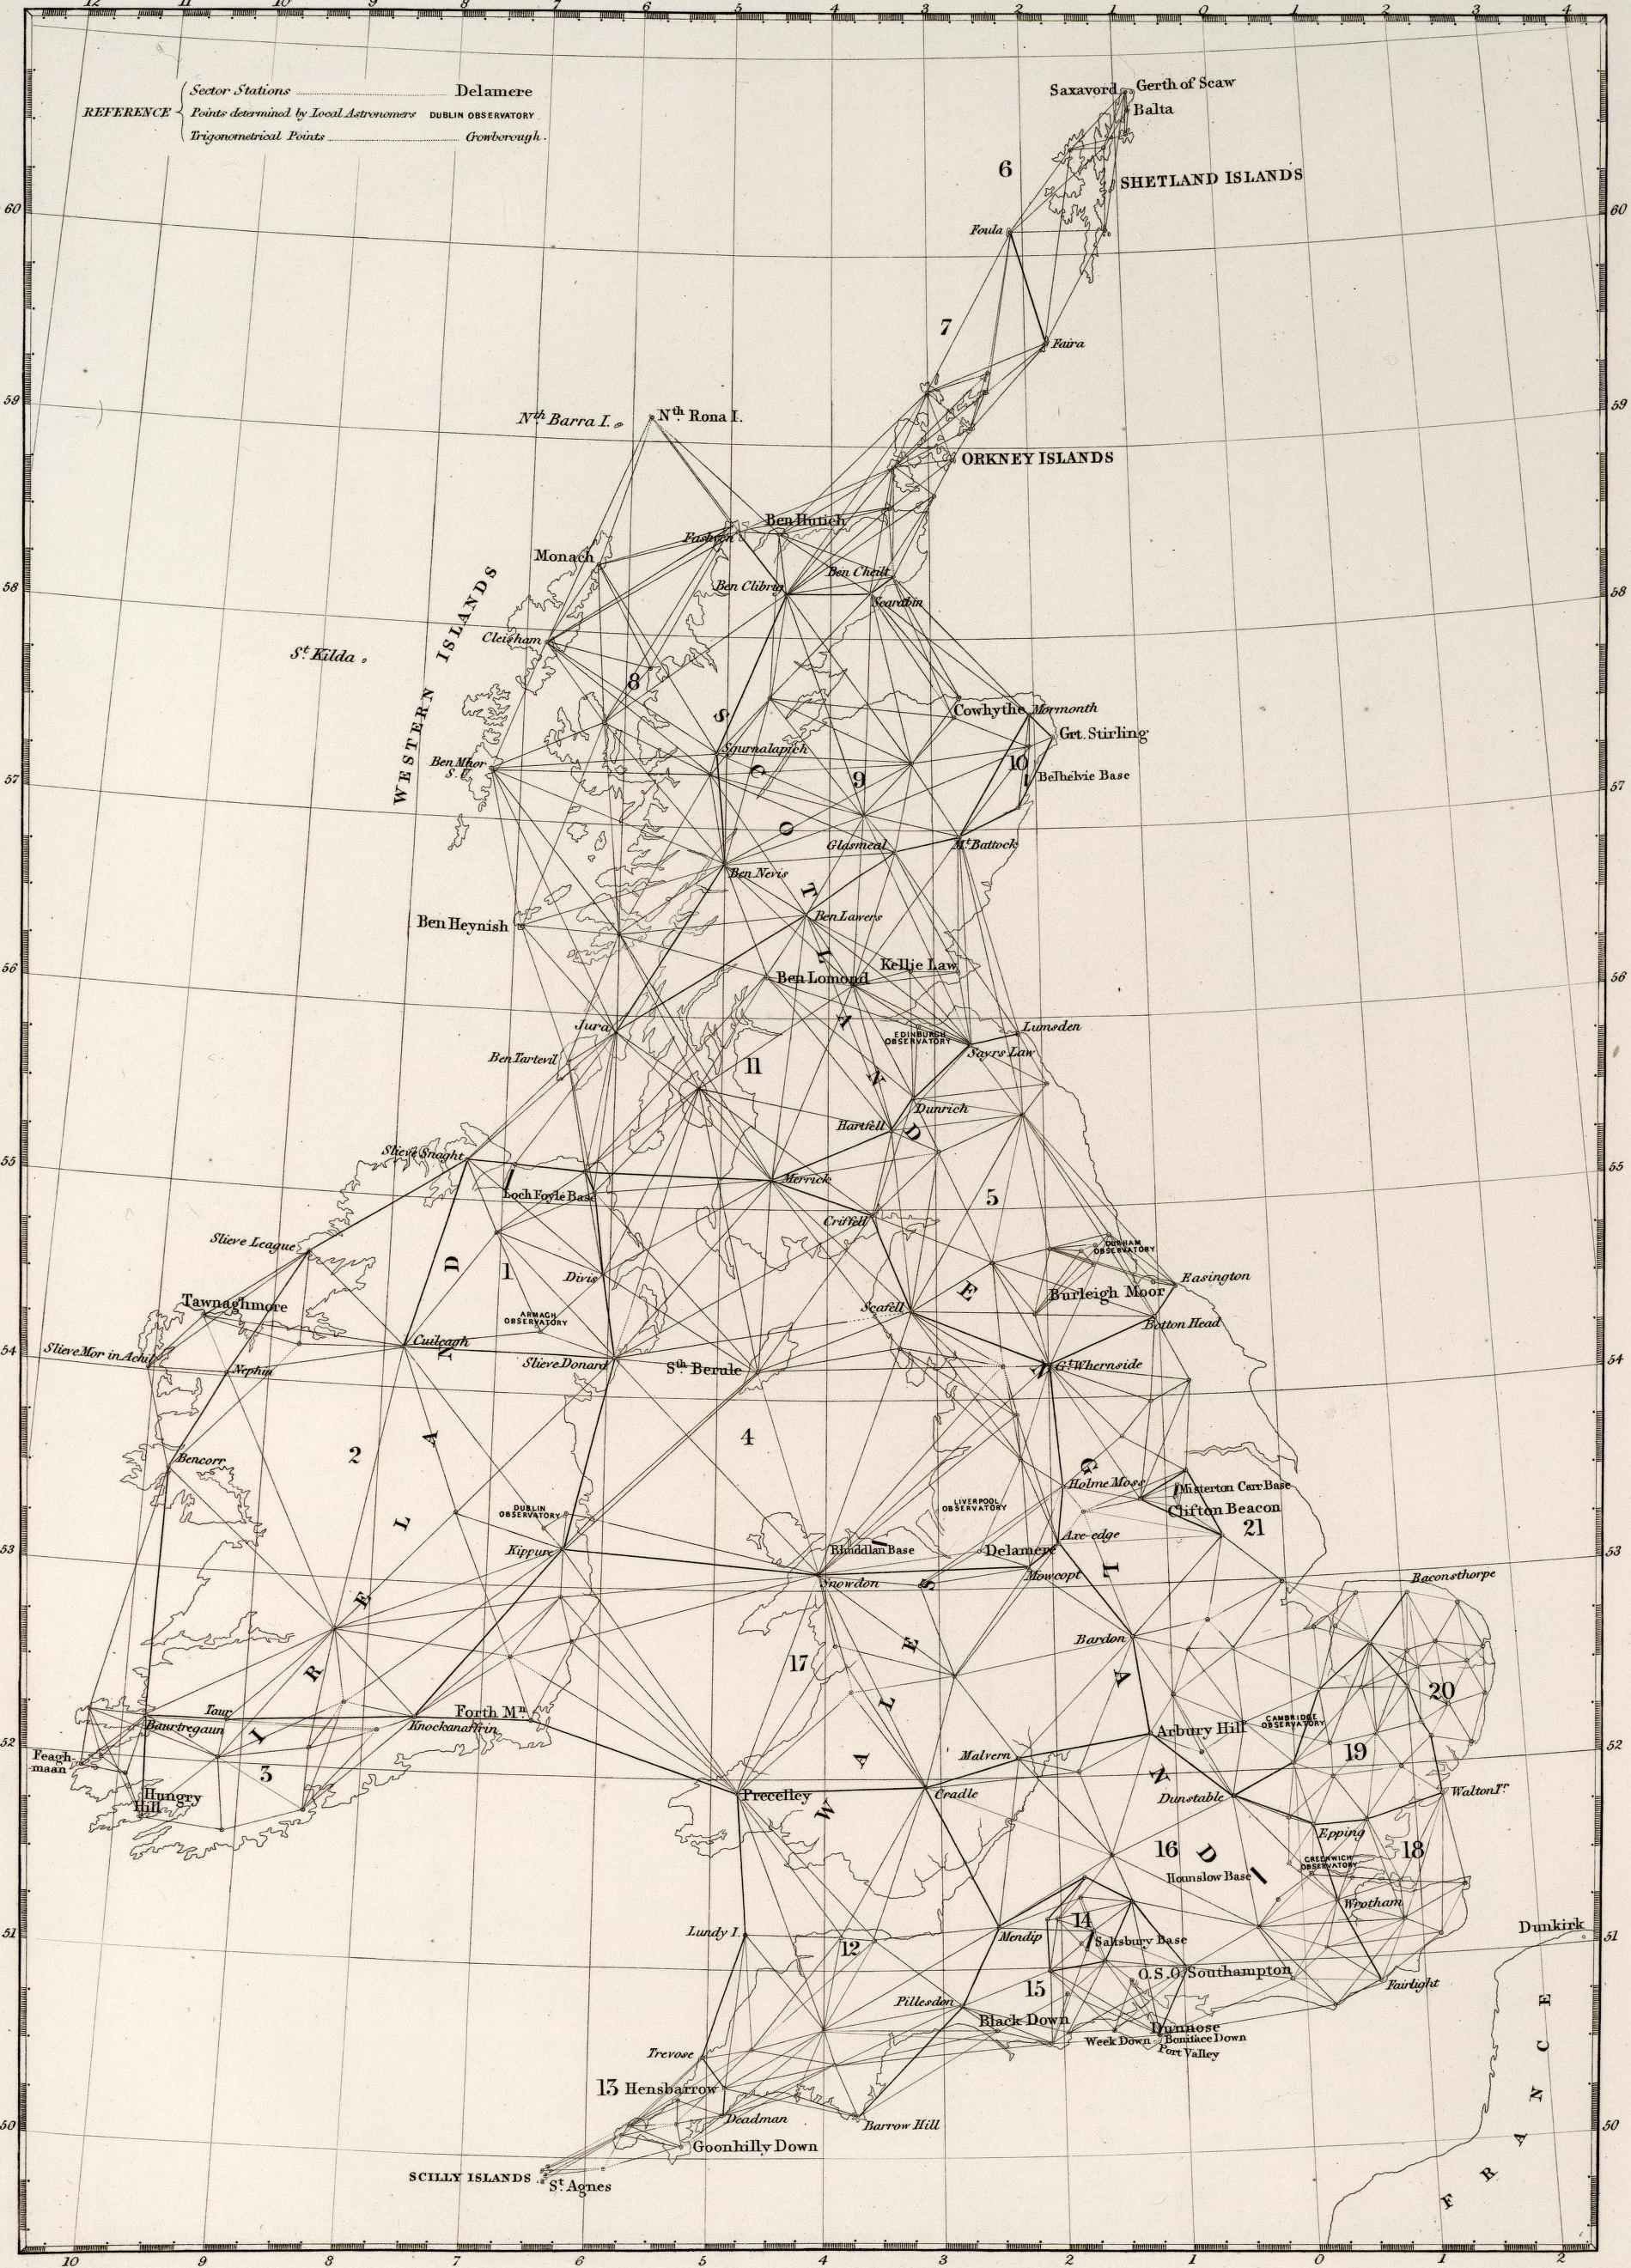
Image: David Rumsey Collection
One of the instruments used by the surveyors for measuring these angles was a custom-built theodolite. This “great” theodolite, crafted in shining wood and metal, was a metre in all dimensions and weighed 90kg. Landmarks visible from afar tend to be high up; surveyors had to cart the theodolite to the top of mountains and winch it up the towers of castles and cathedrals to make measurements.
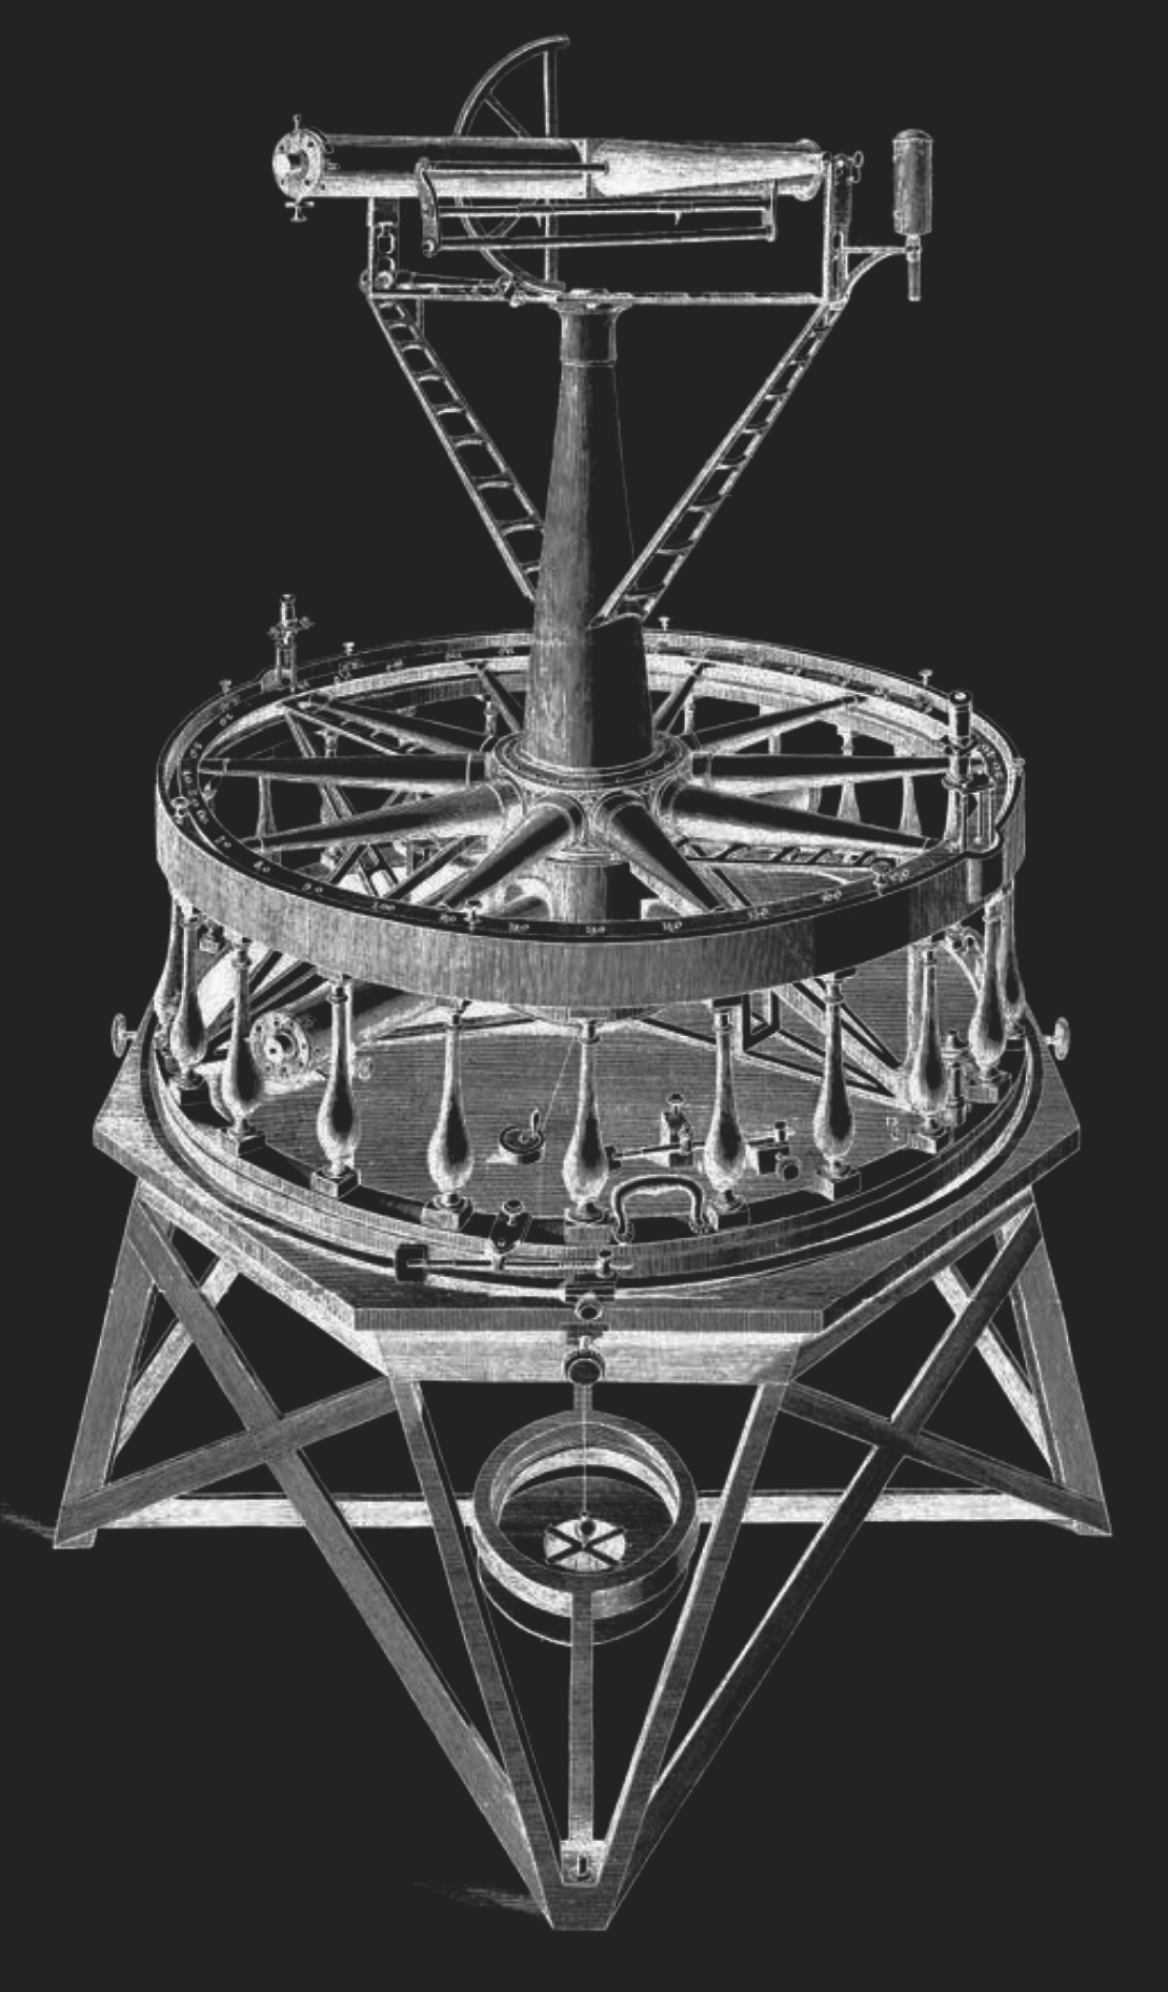
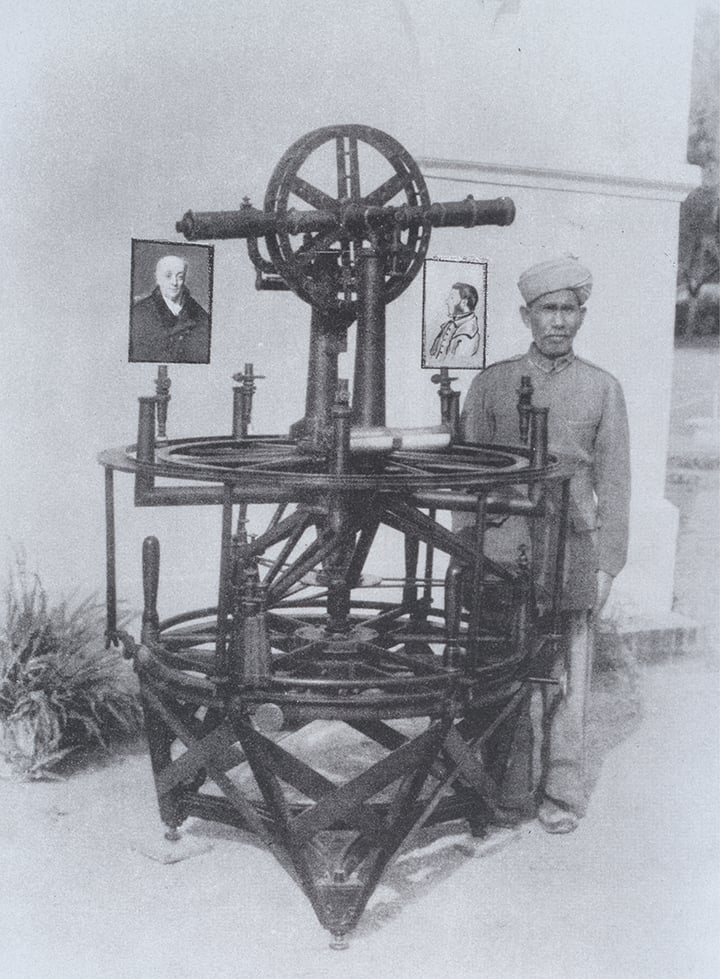
Image: Internet Archive. Getty.
This back-breaking work eventually paid off. The French may never have invaded but the maps helped Britain to collect tax, manage agriculture and plan infrastructure. As the country has changed, so have its uses for maps. Printed maps beloved of countryside walkers account for just over 5% of OS’s revenues today. The agency is largely a geographic-data provider for government and businesses. OS data is being used, for example, to plan the network of electric-car chargers helping Britain towards its net-zero emissions goal. The National Health Service used OS data to track and trace infections during the coronavirus pandemic. And the agency’s data is used to monitor the health of Britain’s peatland, which is important for managing climate change.
Today’s mapping tools are very different from the early technologies. OS’s toolkit includes satellites which whip over Britain’s quarter of a million square kilometres every day. More detailed aerial imagery is captured with planes and drones. But human surveyors have not disappeared entirely; OS continues to employ more than 200. They may not be lumbered with the bulky equipment of the past, but they still have to brave the British weather, rain or shine. ■
Sources: Living with Machines; National Library of Scotland; The Charles Close Society; The First Ordnance Survey Map by Roger Hellyer and Richard Oliver, 2015; OpenStreetMap
Map images: The British Library; David Rumsey Map Collection; Ordnance Survey
More from Graphic detail
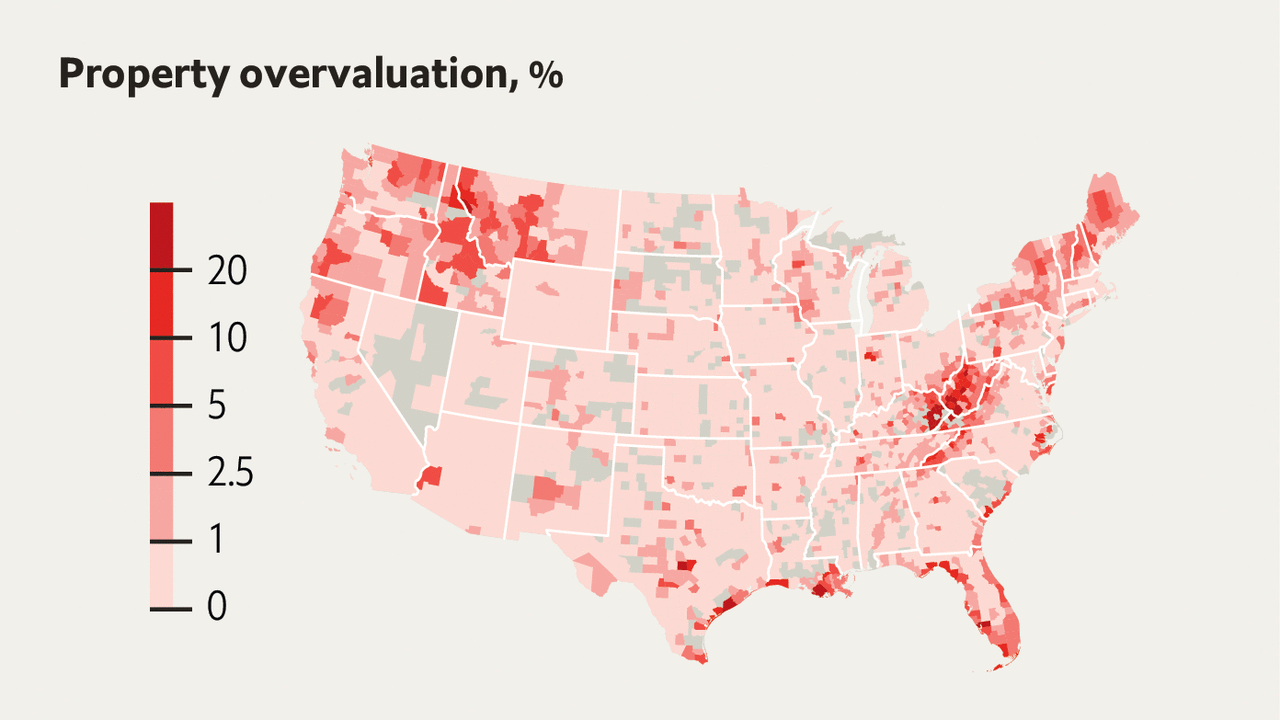
Accounting for flood risk would lower American house prices by $187bn
Unpriced future damages inflate home values the most in rural, inland regions
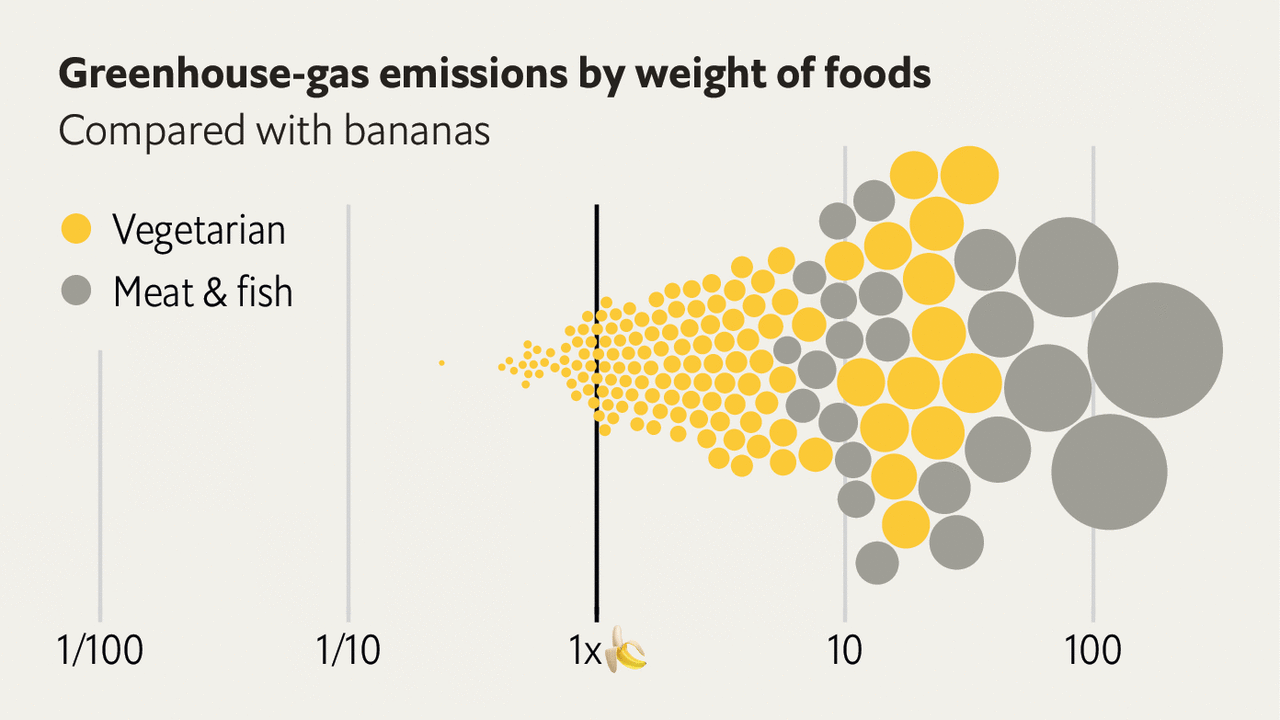
A different way to measure the climate impact of food
Introducing The Economist’s banana index
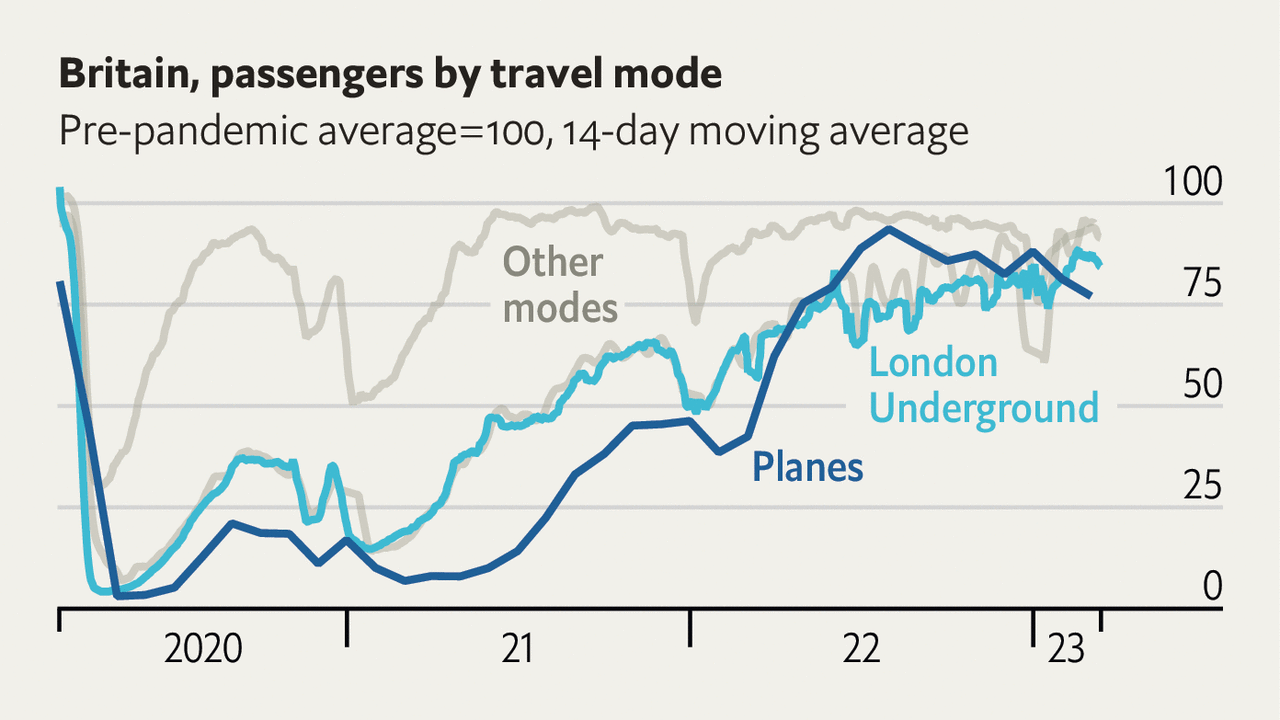
Britons should brace for more travel chaos
Travel demand is closer to its pre-pandemic levels. But transport networks are struggling to keep up